|
chr10_-_75085754
|
8.919
|
NM_001114133
|
SYNPO2L
|
synaptopodin 2-like
|
|
chr2_-_210876560
|
8.183
|
NM_079422
|
MYL1
|
myosin, light chain 1, alkali; skeletal, fast
|
|
chr10_+_69539255
|
8.038
|
NM_032578
|
MYPN
|
myopalladin
|
|
chr17_-_31548167
|
7.924
|
NM_001001437
NM_021006
|
CCL3L3
CCL3
CCL3L1
|
chemokine (C-C motif) ligand 3-like 3
chemokine (C-C motif) ligand 3
chemokine (C-C motif) ligand 3-like 1
|
|
chr10_-_69095362
|
7.915
|
NM_001127384
|
CTNNA3
|
catenin (cadherin-associated protein), alpha 3
|
|
chr12_+_79625538
|
7.848
|
NM_002469
|
MYF6
|
myogenic factor 6 (herculin)
|
|
chr12_-_55931172
|
7.409
|
NM_145064
|
STAC3
|
SH3 and cysteine rich domain 3
|
|
chr11_-_19180092
|
7.326
|
NM_001127656
NM_003476
|
CSRP3
|
cysteine and glycine-rich protein 3 (cardiac LIM protein)
|
|
chr2_+_88148413
|
7.134
|
NM_198274
|
SMYD1
|
SET and MYND domain containing 1
|
|
chr3_-_39209075
|
6.754
|
NM_194293
NM_001198621
|
XIRP1
|
xin actin-binding repeat containing 1
|
|
chr1_-_199657468
|
6.469
|
NM_003281
|
TNNI1
|
troponin I type 1 (skeletal, slow)
|
|
chr10_+_50177192
|
6.454
|
NM_001135196
NM_199459
|
C10orf71
|
chromosome 10 open reading frame 71
|
|
chr10_-_75080784
|
5.965
|
NM_024875
|
SYNPO2L
|
synaptopodin 2-like
|
|
chr4_+_169654742
|
5.849
|
NM_001166108
NM_016081
|
PALLD
|
palladin, cytoskeletal associated protein
|
|
chr6_-_139654807
|
5.842
|
NM_153235
|
TXLNB
|
taxilin beta
|
|
chr4_-_23500706
|
5.833
|
NM_013261
|
PPARGC1A
|
peroxisome proliferator-activated receptor gamma, coactivator 1 alpha
|
|
chr1_+_154478574
|
5.661
|
NM_199173
|
BGLAP
|
bone gamma-carboxyglutamate (gla) protein
|
|
chr15_+_76345577
|
5.509
|
NM_001130183
|
DNAJA4
|
DnaJ (Hsp40) homolog, subfamily A, member 4
|
|
chr2_-_105421661
|
5.495
|
NM_201557
|
FHL2
|
four and a half LIM domains 2
|
|
chr2_-_179623030
|
5.411
|
NM_173648
|
CCDC141
|
coiled-coil domain containing 141
|
|
chr5_+_155686333
|
5.288
|
NM_000337
NM_001128209
NM_172244
|
SGCD
|
sarcoglycan, delta (35kDa dystrophin-associated glycoprotein)
|
|
chrX_-_21686079
|
5.143
|
NM_014332
|
SMPX
|
small muscle protein, X-linked
|
|
chr5_-_142057692
|
5.037
|
NM_001144934
NM_001144935
|
FGF1
|
fibroblast growth factor 1 (acidic)
|
|
chr2_+_238712101
|
4.982
|
NM_198582
|
KLHL30
|
kelch-like 30 (Drosophila)
|
|
chr1_+_40508336
|
4.969
|
|
ZMPSTE24
|
zinc metallopeptidase (STE24 homolog, S. cerevisiae)
|
|
chr3_+_137224266
|
4.967
|
NM_181897
|
PPP2R3A
|
protein phosphatase 2, regulatory subunit B'', alpha
|
|
chr10_+_80569464
|
4.796
|
|
ZMIZ1
|
zinc finger, MIZ-type containing 1
|
|
chr8_+_1980564
|
4.752
|
NM_003970
|
MYOM2
|
myomesin (M-protein) 2, 165kDa
|
|
chr5_+_244625
|
4.646
|
NM_001080478
|
LRRC14B
|
leucine rich repeat containing 14B
|
|
chr1_-_16217025
|
4.499
|
|
HSPB7
|
heat shock 27kDa protein family, member 7 (cardiovascular)
|
|
chr22_-_49363711
|
4.440
|
NM_004377
NM_152246
NM_001145134
NM_001145135
NM_001145136
NM_152245
|
CPT1B
|
carnitine palmitoyltransferase 1B (muscle)
|
|
chr11_+_1897374
|
4.348
|
NM_001042780
NM_001042781
NM_001042782
NM_006757
|
TNNT3
|
troponin T type 3 (skeletal, fast)
|
|
chr14_+_99309688
|
4.324
|
|
EML1
|
echinoderm microtubule associated protein like 1
|
|
chr2_+_220007943
|
4.320
|
NM_005876
|
SPEG
|
SPEG complex locus
|
|
chr12_+_15590811
|
4.305
|
|
PTPRO
|
protein tyrosine phosphatase, receptor type, O
|
|
chrX_-_77801480
|
4.248
|
NM_152694
|
ZCCHC5
|
zinc finger, CCHC domain containing 5
|
|
chr5_-_150501393
|
4.213
|
NM_001193544
|
ANXA6
|
annexin A6
|
|
chr4_+_114190233
|
4.212
|
NM_001148
NM_020977
|
ANK2
|
ankyrin 2, neuronal
|
|
chr5_+_53787187
|
4.180
|
NM_006308
|
HSPB3
|
heat shock 27kDa protein 3
|
|
chr12_+_15590552
|
4.116
|
NM_030668
NM_030669
NM_030670
NM_030671
|
PTPRO
|
protein tyrosine phosphatase, receptor type, O
|
|
chr10_+_88418243
|
4.115
|
NM_001080116
NM_001080114
NM_001080115
NM_001171611
NM_007078
|
LDB3
|
LIM domain binding 3
|
|
chr2_+_85774924
|
4.077
|
NM_006433
NM_012483
|
GNLY
|
granulysin
|
|
chr17_+_39603599
|
4.028
|
NM_080863
|
ASB16
|
ankyrin repeat and SOCS box containing 16
|
|
chr17_-_10265991
|
3.831
|
NM_002472
|
MYH8
|
myosin, heavy chain 8, skeletal muscle, perinatal
|
|
chr6_+_42896771
|
3.809
|
NM_015349
|
KIAA0240
|
KIAA0240
|
|
chr5_-_140875591
|
3.756
|
|
DIAPH1
|
diaphanous homolog 1 (Drosophila)
|
|
chr2_+_233099113
|
3.750
|
NM_000751
|
CHRND
|
cholinergic receptor, nicotinic, delta
|
|
chr12_-_242255
|
3.715
|
NM_001190997
NM_016615
|
SLC6A13
|
solute carrier family 6 (neurotransmitter transporter, GABA), member 13
|
|
chr17_+_35075124
|
3.710
|
NM_003673
|
TCAP
|
titin-cap (telethonin)
|
|
chr1_-_115039614
|
3.709
|
NM_000036
NM_001172626
|
AMPD1
|
adenosine monophosphate deaminase 1
|
|
chr16_-_49205063
|
3.659
|
|
|
|
|
chr1_-_199613427
|
3.574
|
NM_000364
NM_001001430
NM_001001431
NM_001001432
|
TNNT2
|
troponin T type 2 (cardiac)
|
|
chr11_-_62213946
|
3.566
|
NM_203422
|
LRRN4CL
|
LRRN4 C-terminal like
|
|
chr11_-_62213577
|
3.563
|
|
LRRN4CL
|
LRRN4 C-terminal like
|
|
chr13_-_59223074
|
3.505
|
|
|
|
|
chr4_+_120276386
|
3.479
|
NM_016599
|
MYOZ2
|
myozenin 2
|
|
chr14_+_23670514
|
3.421
|
NM_203402
|
FITM1
|
fat storage-inducing transmembrane protein 1
|
|
chr11_+_1816808
|
3.409
|
NM_003282
|
TNNI2
|
troponin I type 2 (skeletal, fast)
|
|
chr15_+_61676604
|
3.375
|
NM_203373
|
FBXL22
|
F-box and leucine-rich repeat protein 22
|
|
chr3_+_195336631
|
3.362
|
|
HES1
|
hairy and enhancer of split 1, (Drosophila)
|
|
chr5_-_16561936
|
3.361
|
NM_019000
|
FAM134B
|
family with sequence similarity 134, member B
|
|
chr1_-_199613406
|
3.356
|
|
TNNT2
|
troponin T type 2 (cardiac)
|
|
chr3_+_195336625
|
3.352
|
NM_005524
|
HES1
|
hairy and enhancer of split 1, (Drosophila)
|
|
chr3_-_57301749
|
3.343
|
NM_001142733
|
ASB14
|
ankyrin repeat and SOCS box containing 14
|
|
chr8_-_72431274
|
3.307
|
NM_172058
NM_172059
NM_172060
|
EYA1
|
eyes absent homolog 1 (Drosophila)
|
|
chr15_+_76171981
|
3.299
|
NM_001101404
|
SH2D7
|
SH2 domain containing 7
|
|
chr13_+_75232797
|
3.278
|
NM_015842
|
LMO7
|
LIM domain 7
|
|
chr15_+_40427592
|
3.184
|
NM_212465
|
CAPN3
|
calpain 3, (p94)
|
|
chr3_+_120982020
|
3.181
|
NM_003889
NM_033013
|
NR1I2
|
nuclear receptor subfamily 1, group I, member 2
|
|
chr17_-_10500189
|
3.161
|
NM_002470
|
MYH3
|
myosin, heavy chain 3, skeletal muscle, embryonic
|
|
chr7_+_18501876
|
3.159
|
NM_014707
NM_178423
|
HDAC9
|
histone deacetylase 9
|
|
chr6_+_53991672
|
3.153
|
NM_138569
|
C6orf142
|
chromosome 6 open reading frame 142
|
|
chr3_+_8750485
|
3.130
|
NM_033337
NM_001234
|
CAV3
|
caveolin 3
|
|
chr1_+_12325632
|
3.122
|
|
VPS13D
|
vacuolar protein sorting 13 homolog D (S. cerevisiae)
|
|
chr6_-_33268177
|
3.079
|
NM_001163771
NM_080679
NM_080680
NM_080681
|
COL11A2
|
collagen, type XI, alpha 2
|
|
chr13_+_110637173
|
3.060
|
NM_001113513
|
ARHGEF7
|
Rho guanine nucleotide exchange factor (GEF) 7
|
|
chr3_+_35696119
|
3.053
|
NM_001025068
NM_001025069
|
ARPP21
|
cAMP-regulated phosphoprotein, 21kDa
|
|
chr17_+_42641712
|
3.051
|
NM_002476
|
MYL4
|
myosin, light chain 4, alkali; atrial, embryonic
|
|
chr12_+_108038774
|
3.030
|
|
ACACB
|
acetyl-CoA carboxylase beta
|
|
chr1_+_158317967
|
3.025
|
NM_004983
|
KCNJ9
|
potassium inwardly-rectifying channel, subfamily J, member 9
|
|
chr7_-_41709191
|
3.024
|
NM_002192
|
INHBA
|
inhibin, beta A
|
|
chr1_-_154727014
|
2.996
|
|
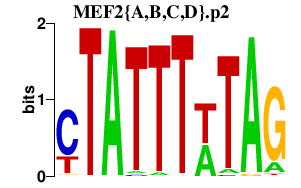
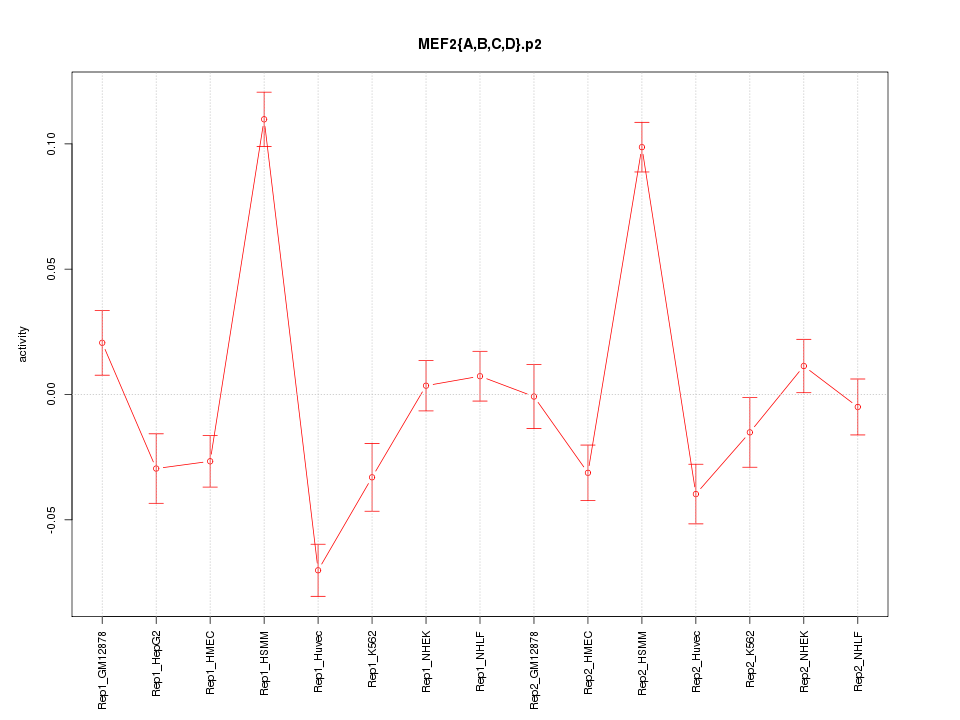
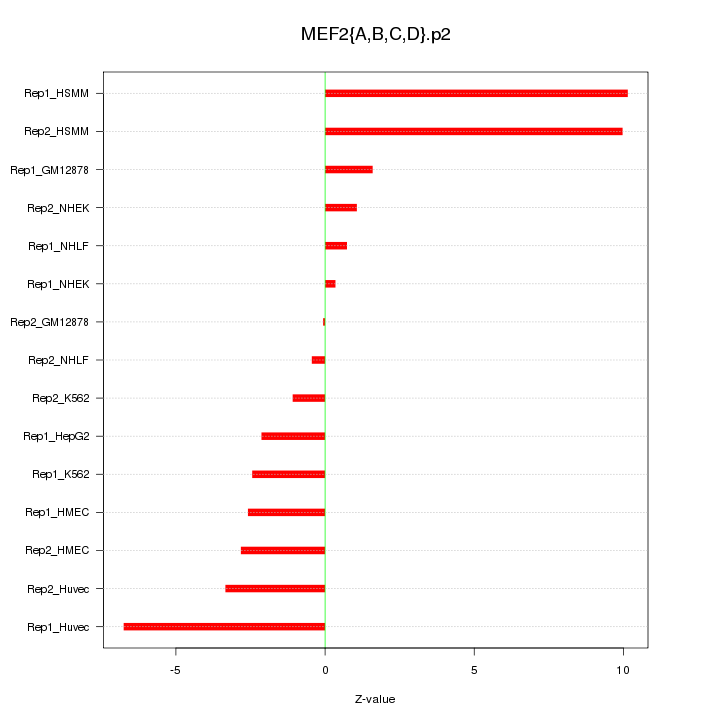
MEF2D
|
myocyte enhancer factor 2D
|
|
chr3_+_129117007
|
2.989
|
|
KBTBD12
|
kelch repeat and BTB (POZ) domain containing 12
|
|
chr22_-_35545462
|
2.978
|
NM_002854
|
PVALB
|
parvalbumin
|
|
chr2_-_236837726
|
2.970
|
NM_212556
|
ASB18
|
ankyrin repeat and SOCS box containing 18
|
|
chr12_-_49689295
|
2.953
|
NM_001174130
|
SLC11A2
|
solute carrier family 11 (proton-coupled divalent metal ion transporters), member 2
|
|
chr10_+_88418147
|
2.923
|
NM_001171610
|
LDB3
|
LIM domain binding 3
|
|
chrX_+_152699616
|
2.905
|
NM_001170760
NM_001170761
NM_014370
|
SRPK3
|
SRSF protein kinase 3
|
|
chr6_+_131613196
|
2.901
|
NM_004842
NM_138633
|
AKAP7
|
A kinase (PRKA) anchor protein 7
|
|
chr8_+_67201684
|
2.891
|
NM_033058
NM_184085
NM_184086
NM_184087
|
TRIM55
|
tripartite motif containing 55
|
|
chr16_+_31132842
|
2.880
|
NM_001008274
|
TRIM72
|
tripartite motif containing 72
|
|
chr3_+_42702014
|
2.880
|
NM_152393
|
KBTBD5
|
kelch repeat and BTB (POZ) domain containing 5
|
|
chr13_-_50315832
|
2.859
|
NM_198989
|
DLEU7
|
deleted in lymphocytic leukemia, 7
|
|
chr17_-_10362583
|
2.838
|
NM_005963
|
MYH1
|
myosin, heavy chain 1, skeletal muscle, adult
|
|
chr15_+_66695932
|
2.812
|
NM_001190456
|
CORO2B
|
coronin, actin binding protein, 2B
|
|
chr8_-_27906287
|
2.805
|
NM_173833
|
SCARA5
|
scavenger receptor class A, member 5 (putative)
|
|
chr15_-_68781662
|
2.784
|
NM_001008224
|
UACA
|
uveal autoantigen with coiled-coil domains and ankyrin repeats
|
|
chr11_+_45072139
|
2.760
|
NM_020229
|
PRDM11
|
PR domain containing 11
|
|
chr2_-_162808123
|
2.748
|
NM_004460
|
FAP
|
fibroblast activation protein, alpha
|
|
chr2_+_102744921
|
2.728
|
NM_144632
|
TMEM182
|
transmembrane protein 182
|
|
chr16_+_82885821
|
2.688
|
NM_021197
|
WFDC1
|
WAP four-disulfide core domain 1
|
|
chr22_-_41366550
|
2.687
|
NM_001165877
|
ATP5L2
|
ATP synthase, H+ transporting, mitochondrial Fo complex, subunit G2
|
|
chr4_-_1185144
|
2.671
|
|
LOC100130872
|
hypothetical LOC100130872
|
|
chr2_+_69055208
|
2.611
|
NM_019617
|
GKN1
|
gastrokine 1
|
|
chr5_-_142045770
|
2.606
|
NM_000800
|
FGF1
|
fibroblast growth factor 1 (acidic)
|
|
chr16_-_73798539
|
2.593
|
NM_001025200
|
CTRB1
CTRB2
|
chymotrypsinogen B1
chymotrypsinogen B2
|
|
chr16_-_31347151
|
2.591
|
NM_005205
|
COX6A2
|
cytochrome c oxidase subunit VIa polypeptide 2
|
|
chr12_-_49689255
|
2.590
|
|
SLC11A2
|
solute carrier family 11 (proton-coupled divalent metal ion transporters), member 2
|
|
chr4_-_5881271
|
2.588
|
|
CRMP1
|
collapsin response mediator protein 1
|
|
chr21_-_35174742
|
2.574
|
|
RUNX1
|
runt-related transcription factor 1
|
|
chr1_+_26220852
|
2.570
|
NM_004455
|
EXTL1
|
exostoses (multiple)-like 1
|
|
chr7_+_30917939
|
2.547
|
NM_198098
|
AQP1
|
aquaporin 1 (Colton blood group)
|
|
chr9_+_115367122
|
2.546
|
NM_134427
|
RGS3
|
regulator of G-protein signaling 3
|
|
chr1_+_26220895
|
2.515
|
|
EXTL1
|
exostoses (multiple)-like 1
|
|
chr17_-_39094787
|
2.504
|
NM_001040002
|
MEOX1
|
mesenchyme homeobox 1
|
|
chr1_+_158352143
|
2.473
|
NM_000702
|
ATP1A2
|
ATPase, Na+/K+ transporting, alpha 2 polypeptide
|
|
chr17_-_31441390
|
2.441
|
NM_002983
|
CCL3
|
chemokine (C-C motif) ligand 3
|
|
chr3_-_48573556
|
2.428
|
|
PFKFB4
|
6-phosphofructo-2-kinase/fructose-2,6-biphosphatase 4
|
|
chr12_-_109842736
|
2.426
|
NM_000432
|
MYL2
|
myosin, light chain 2, regulatory, cardiac, slow
|
|
chr14_-_93493519
|
2.411
|
NM_016150
|
ASB2
|
ankyrin repeat and SOCS box containing 2
|
|
chr16_-_66535457
|
2.357
|
NM_000229
|
LCAT
|
lecithin-cholesterol acyltransferase
|
|
chr3_+_185300660
|
2.352
|
NM_182589
|
HTR3E
|
5-hydroxytryptamine (serotonin) receptor 3, family member E
|
|
chr17_+_42641426
|
2.345
|
NM_001002841
|
MYL4
|
myosin, light chain 4, alkali; atrial, embryonic
|
|
chr5_-_42847716
|
2.343
|
NM_001085486
NM_001093726
NM_005410
|
SEPP1
|
selenoprotein P, plasma, 1
|
|
chr2_+_96818048
|
2.266
|
|
CNNM4
|
cyclin M4
|
|
chr12_-_47679459
|
2.263
|
|
DDN
|
dendrin
|
|
chr1_+_158426908
|
2.256
|
NM_001231
|
CASQ1
|
calsequestrin 1 (fast-twitch, skeletal muscle)
|
|
chr1_-_229071957
|
2.239
|
NM_001136494
|
C1orf198
|
chromosome 1 open reading frame 198
|
|
chr19_-_55912006
|
2.205
|
NM_016148
|
SHANK1
|
SH3 and multiple ankyrin repeat domains 1
|
|
chr2_-_165768798
|
2.200
|
NM_001081676
NM_001081677
NM_006922
|
SCN3A
|
sodium channel, voltage-gated, type III, alpha subunit
|
|
chr1_-_205012348
|
2.185
|
NM_000572
|
IL10
|
interleukin 10
|
|
chr10_+_70172257
|
2.157
|
|
CCAR1
|
cell division cycle and apoptosis regulator 1
|
|
chr5_-_66528330
|
2.155
|
NM_005582
|
CD180
|
CD180 molecule
|
|
chr12_+_118100977
|
2.155
|
NM_014365
|
HSPB8
|
heat shock 22kDa protein 8
|
|
chr2_+_44356100
|
2.152
|
NM_000341
|
SLC3A1
|
solute carrier family 3 (cystine, dibasic and neutral amino acid transporters, activator of cystine, dibasic and neutral amino acid transport), member 1
|
|
chr1_-_116112921
|
2.143
|
NM_001232
|
CASQ2
|
calsequestrin 2 (cardiac muscle)
|
|
chr2_-_217268492
|
2.132
|
NM_000599
|
IGFBP5
|
insulin-like growth factor binding protein 5
|
|
chr10_-_115413630
|
2.130
|
NM_006175
NM_198060
|
NRAP
|
nebulin-related anchoring protein
|
|
chr6_-_133126278
|
2.118
|
NM_078488
|
VNN2
|
vanin 2
|
|
chr10_+_21924265
|
2.102
|
|
MLLT10
|
myeloid/lymphoid or mixed-lineage leukemia (trithorax homolog, Drosophila); translocated to, 10
|
|
chr11_+_1817294
|
2.082
|
NM_001145829
|
TNNI2
|
troponin I type 2 (skeletal, fast)
|
|
chr19_+_4983899
|
2.081
|
|
|
|
|
chr10_+_91142301
|
2.068
|
NM_001548
|
IFIT1
|
interferon-induced protein with tetratricopeptide repeats 1
|
|
chr1_+_144124547
|
2.063
|
NM_145277
NM_202004
NM_213652
NM_213653
|
HFE2
|
hemochromatosis type 2 (juvenile)
|
|
chr5_-_83052606
|
2.062
|
NM_001884
|
HAPLN1
|
hyaluronan and proteoglycan link protein 1
|
|
chr9_+_126094067
|
2.037
|
NM_001166170
NM_001166171
|
NEK6
|
NIMA (never in mitosis gene a)-related kinase 6
|
|
chr6_-_130224108
|
2.028
|
NM_001010876
|
C6orf191
|
chromosome 6 open reading frame 191
|
|
chr2_+_201182187
|
2.025
|
|
AOX1
|
aldehyde oxidase 1
|
|
chr8_+_17866373
|
2.024
|
|
PCM1
|
pericentriolar material 1
|
|
chr8_-_131483395
|
2.017
|
NM_018482
|
ASAP1
|
ArfGAP with SH3 domain, ankyrin repeat and PH domain 1
|
|
chr17_-_45626364
|
1.996
|
|
|
|
|
chr14_+_77939845
|
1.987
|
NM_004796
|
NRXN3
|
neurexin 3
|
|
chr6_-_123999640
|
1.978
|
NM_006073
|
TRDN
|
triadin
|
|
chr6_+_136214495
|
1.974
|
NM_018945
|
PDE7B
|
phosphodiesterase 7B
|
|
chr16_+_14187965
|
1.963
|
|
MKL2
|
MKL/myocardin-like 2
|
|
chr3_-_11585264
|
1.939
|
NM_001128221
|
VGLL4
|
vestigial like 4 (Drosophila)
|
|
chr18_-_49944986
|
1.918
|
|
MBD2
|
methyl-CpG binding domain protein 2
|
|
chr1_-_116112853
|
1.884
|
|
CASQ2
|
calsequestrin 2 (cardiac muscle)
|
|
chr1_+_181380837
|
1.872
|
|
LAMC1
|
laminin, gamma 1 (formerly LAMB2)
|
|
chr10_+_126620681
|
1.864
|
NM_017580
|
ZRANB1
|
zinc finger, RAN-binding domain containing 1
|
|
chr14_+_95792299
|
1.849
|
NM_000710
|
BDKRB1
|
bradykinin receptor B1
|
|
chr20_+_60558104
|
1.840
|
NM_178463
|
C20orf166
|
chromosome 20 open reading frame 166
|
|
chr9_-_129580732
|
1.831
|
NM_170600
|
SH2D3C
|
SH2 domain containing 3C
|
|
chr2_+_37282516
|
1.822
|
|
LOC100505876
|
hypothetical LOC100505876
|
|
chr2_-_190635566
|
1.815
|
NM_005259
|
MSTN
|
myostatin
|
|
chr1_+_213245507
|
1.797
|
NM_001017424
|
KCNK2
|
potassium channel, subfamily K, member 2
|
|
chr4_+_146820805
|
1.796
|
NM_001080531
|
C4orf51
|
chromosome 4 open reading frame 51
|
|
chr9_+_135387106
|
1.770
|
NM_001145320
|
ADAMTSL2
|
ADAMTS-like 2
|
|
chr11_-_30910074
|
1.769
|
NM_020869
|
DCDC5
|
doublecortin domain containing 5
|
|
chr7_-_76667045
|
1.759
|
NM_006682
|
FGL2
|
fibrinogen-like 2
|
|
chr1_-_228916486
|
1.744
|
|
AGT
|
angiotensinogen (serpin peptidase inhibitor, clade A, member 8)
|
|
chr14_+_71065794
|
1.743
|
NM_015556
|
SIPA1L1
|
signal-induced proliferation-associated 1 like 1
|
|
chr1_-_144426918
|
1.723
|
NM_007053
|
CD160
|
CD160 molecule
|
|
chr14_-_88090641
|
1.708
|
NM_007039
|
PTPN21
|
protein tyrosine phosphatase, non-receptor type 21
|
|
chr10_+_91082218
|
1.706
|
NM_001031683
|
IFIT3
|
interferon-induced protein with tetratricopeptide repeats 3
|
|
chr3_-_46224791
|
1.705
|
NM_001295
|
CCR1
|
chemokine (C-C motif) receptor 1
|
|
chr6_-_169395972
|
1.703
|
NM_003247
|
THBS2
|
thrombospondin 2
|
|
chr17_-_26672757
|
1.698
|
NM_001003927
NM_014210
|
EVI2A
|
ecotropic viral integration site 2A
|
|
chr21_-_18697829
|
1.692
|
NM_002772
|
TMPRSS15
|
transmembrane protease, serine 15
|
|
chr9_+_126094388
|
1.690
|
NM_001166169
|
NEK6
|
NIMA (never in mitosis gene a)-related kinase 6
|
|
chr6_-_76259976
|
1.683
|
NM_015687
|
FILIP1
|
filamin A interacting protein 1
|
|
chr12_-_16652202
|
1.682
|
NM_001001395
|
LMO3
|
LIM domain only 3 (rhombotin-like 2)
|
|
chr7_+_100037817
|
1.681
|
NM_002593
|
PCOLCE
|
procollagen C-endopeptidase enhancer
|
|
chr2_+_149603226
|
1.664
|
NM_177964
|
LYPD6B
|
LY6/PLAUR domain containing 6B
|
|
chr4_-_169476391
|
1.663
|
NM_017631
|
DDX60
|
DEAD (Asp-Glu-Ala-Asp) box polypeptide 60
|
|
chr10_+_111755715
|
1.660
|
NM_019903
|
ADD3
|
adducin 3 (gamma)
|
|
chr12_-_68379331
|
1.652
|
NM_032735
|
BEST3
|
bestrophin 3
|
|
chr4_+_111053488
|
1.648
|
NM_001178130
NM_001178131
NM_001963
|
EGF
|
epidermal growth factor
|
|
chr3_+_50291521
|
1.647
|
NM_153215
|
C3orf45
|
chromosome 3 open reading frame 45
|
|
chr7_+_18502342
|
1.646
|
NM_058176
NM_178425
|
HDAC9
|
histone deacetylase 9
|
|
chr10_+_71231693
|
1.640
|
|
COL13A1
|
collagen, type XIII, alpha 1
|
|
chr12_-_25041639
|
1.632
|
NM_001101339
|
C12orf77
|
chromosome 12 open reading frame 77
|
|
chr9_-_35640852
|
1.631
|
NM_014450
|
SIT1
|
signaling threshold regulating transmembrane adaptor 1
|
|
chr10_-_75071205
|
1.613
|
|
MYOZ1
|
myozenin 1
|
|
chr1_-_31618405
|
1.587
|
NM_004102
|
FABP3
|
fatty acid binding protein 3, muscle and heart (mammary-derived growth inhibitor)
|
|
chr17_+_55098280
|
1.584
|
|
CLTC
|
clathrin, heavy chain (Hc)
|
|
chr1_-_116112684
|
1.583
|
|
CASQ2
|
calsequestrin 2 (cardiac muscle)
|
|
chr2_-_99412694
|
1.573
|
|
REV1
|
REV1 homolog (S. cerevisiae)
|
|
chr5_+_121493113
|
1.566
|
NM_207317
|
ZNF474
|
zinc finger protein 474
|
|
chrX_-_11194015
|
1.540
|
NM_013423
|
ARHGAP6
|
Rho GTPase activating protein 6
|